Welcome to a simple guide to intermarket analysis. This is the study of how various financial markets are related to each other. John J. Murphy’s Trading with Intermarket Analysis inspires these concepts.
We now live in a world where all markets are related. Furthermore, this encompasses the whole swath of asset classes, including treasuries, stocks, commodities, futures, foreign exchange & cryptocurrencies.

Traders can now gain exposure to any of these markets, whether it be bull, bear, or sideways markets through exchange-traded funds.
Exchange-Traded Funds
Exchange-traded funds (ETFs) are available that cover all market sectors (and most industry groups).
They also now encompass alternate assets like commodities and currencies.
Because of this, ETFs revolutionized the world of intermarket trading by making it increasingly easy to implement global intermarket strategies.
The Study of Global Capital Markets Relationships
It’s very important to remember that intermarket relationships are in constant flux. Traders should not hold fast to the generalized relationships discussed here. They should be agile and adapt to evolving behaviors between markets.
This requires continual nurture of a big picture macro-perspective accompanied by its many moving parts in microcosms of the markets.
For example, historically, a general principal is that commodity prices and foreign currencies trend in the same direction of each other and in the opposite direction of the U.S. dollar. However, due to the unpredictability of the recent decade, we see what appears to be a decoupling of that relationship. At the time of this writing, the chart shows several periods in the past few years where their 20-day rolling correlation was positive.

Intermarket Analysis & the Business Cycle
Intermarket analysis plays an important role in the business cycle.
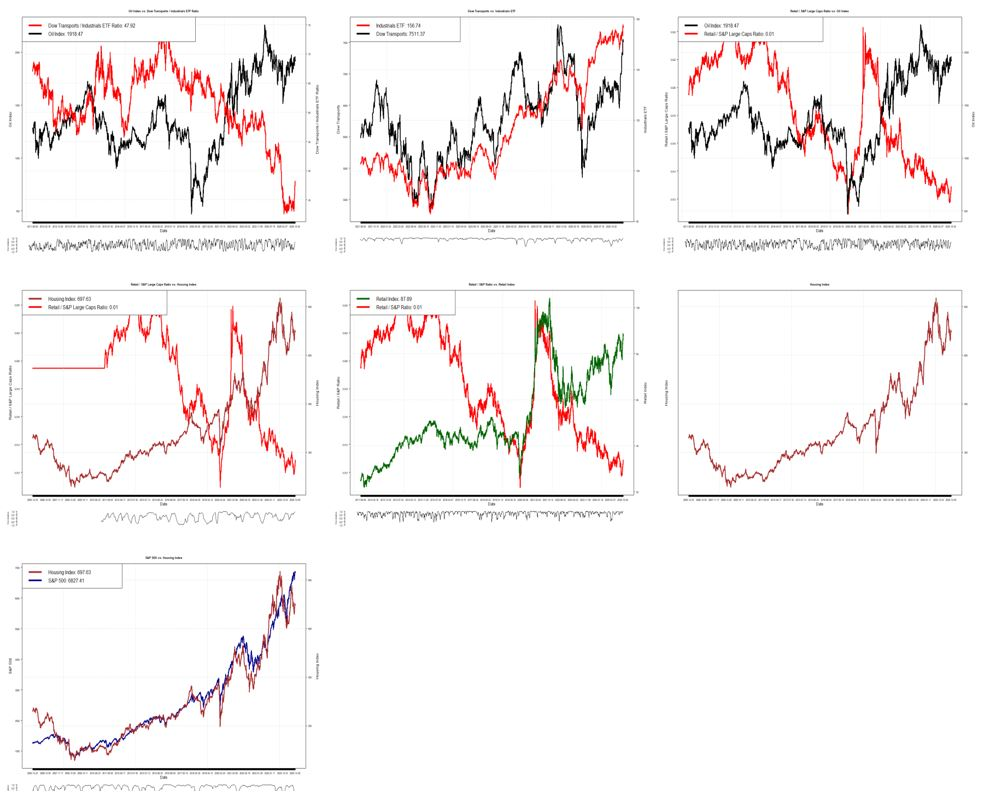
Generally speaking, economically sensitive groups like consumer discretionary stocks (which include retailers), technology and transportation stocks usually do better than most other stocks near the start of a new bull market in stocks.
Small-cap stocks also lead at market bottoms. Near market tops, those very same groups usually turn down first.
Energy stocks (which are tied to the price of oil) have a tendency to become market leaders near the end of a bull market in stocks. Energy leadership is almost always a dangerous warning sign for the stock market. One of the ways to tell that the stock market is peaking is when money starts to flow out of energy stocks and into defensive sectors like consumer staples, health care, and utilities.
The Impact of the Business Cycle on Market Sectors
Intermarket analysis combined with monitoring of business cycles ties into sector rotation strategies. The U.S. stock market encompasses market sectors (which are further break down into industry groups). It has 10 sectors and approximately 90 industry groups.
The nature of intermarket relationships facilitates movement into and out of various market sectors at different stages of the business cycle.
General Intermarket Relationships
As mentioned, intermarket relationships can change over time. Correlations can de-couple over a period of time, and then re-couple.
We know that all global markets are linked now. Hence, analysis of one should include analysis of the others.
In this simple guide to intermarket analysis, let’s take a look at some very general principles based on historical behavior.
- The dollar & commodities trend in opposite directions.
- Bond prices & commodities trend in opposite directions.
- Bond & stock prices tend to trend inversely.
- Stocks & commodities show close correlations in recent years.
Now, we’ll cover some general behaviors.
- Bonds usually change direction before stocks.
- Stocks usually change direction before commodities.
- Bond yields peak first at tops, stocks second, and commodities last.
- These rotations are less reliable at bottoms than at tops.
Lastly, let’s take a look at foreign influence.
- All global stocks are closely correlated.
- A rising dollar benefits U.S. stocks.
- A weaker dollar favors foreign stocks.
- Emerging markets and commodities show close positive correlations.
The Dollar & Commodities Trend in Opposite Directions
One of the most consistent and reliable relationships is the inverse correlation between the U.S. dollar and commodity prices. It follows that there is a close positive link between commodities and foreign currencies.
Stocks & Commodities Become Highly Correlated
The deflationary impact of the housing collapse tightened the correlation between stocks and commodities. There are several key relationships involved between these two asset classes, but here are a few.
Copper and the silver/gold ratio influences stock market direction. The world views copper as a barometer of strength of the global economy. They call is Dr. Copper with a Ph.D. in economics for a reason. It indicates industrial strength. A rise in copper price implies economic health, while a drop in the price of copper suggests a weakening global economy.

Although silver is considered to be a precious metal, it’s also an industrial metal. It’s the industrial role that gives it some value in helping to measure economic trends. Generally speaking, a rising silver price implies economic strength, while a falling silver price implies the opposite.

Stocks & the Dollar
In recent decades, stocks and the dollar tend to trend in opposite directions. That’s primarily due to the fact that commodities and stocks also correlate closely in recent years. The direction of the dollar also has an impact on the relative attractiveness of foreign stocks versus those in the United States. Commodities are closely linked to emerging markets.
That being said, the link between the U.S. dollar and the stock market is still one of the most inconsistent intermarket links.
Further Reading from a Simple Guide to Intermarket Analysis
Again, this article provides a summary/overview of the key principles and concepts from John J. Murphy’s Trading with Intermarket Analysis. To gain a more holistic perspective with rich historically examples, we highly recommend his book.
Additionally, to understand how the principles discussed here further break down into inflationary and deflationary categories, refer to StockCharts.com’s overview of intermarket analysis.
A Simple Guide to Intermarket Analysis: Where to go Next
With these concepts in mind, things can get complicated and hard to understand very quickly. For beginners just starting to learn about the markets and its interrelationships, it’s best to just start watching the markets. Do this by simply monitoring price action and charts from the major global asset classes.
Learn how you can start following the major global markets here.